Okay so you must be wondering, how will I be able to properly track my newsletter sends and manage its performance?
Well, we touched briefly on this with Email Sends, but this is a more extensive guide on the statistics involved in managing your newsletter. To start off, we’ll check the Global Statistics which shows an overall performance, before going into specific newsletter performance metrics.
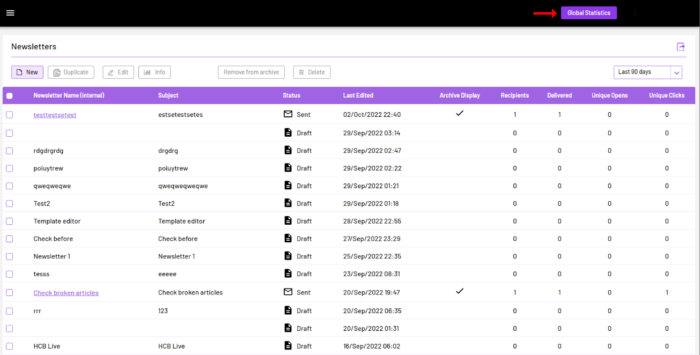
After sending out a bunch of emails, the next time you open the Newsletter tab, you will see everything being displayed as we’ve talked about earlier. (To best understand this, be sure to have gone through the Email Sends guide first)
- At the top right, you’ll see the “Global Statistics” button.
- Be sure to click on it, and you’ll be greeted with the screen below:
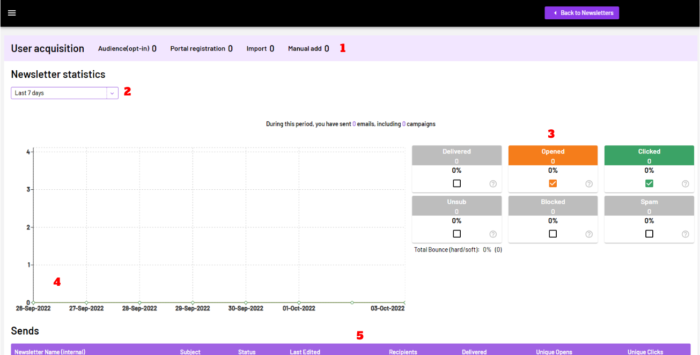
This summarised display shows all your newsletter performance in a simple yet efficient stats system. You can also find this by clicking on the “Reports – Send statistics” on your site homepage where the other main tabs are. We’ll go over the sections above so you can get the major points on this.
1 – User Acquisitions: This tab shows a summary of audience updates for your newsletters. This info includes;
-
Audience(opt-in): This shows the number of newly gained subscribers during the period displayed.
-
Portal registrations: This is the number of tracker sign-ups during the period displayed.
-
Import: The number of imports you’ve made to your audience during the period displayed.
-
Manual Add: The number of manual updates made to the audience during the period displayed.
2 – Date display: The dropdown on the left controls how you see your stats based on the time period you’re looking out for. The dates you can check for are Today, Yesterday, Last 7 days, This month, Last month, and Custom, where custom means using a specific date selection.
3 – Block Metric Display: This display gives a percentage view of the main Newsletter metrics; Delivered, Opened, Clicked, Unsub, Blocked, and Spam. The percentage of these work with respect to each other. This means that Delivered is a percentage of emails sent, Opened would be a percentage of Delivered, and Clicked would be a percentage of Opened. As for Unsub, Blocked and Spam, they are a percentage of emails sent alone.
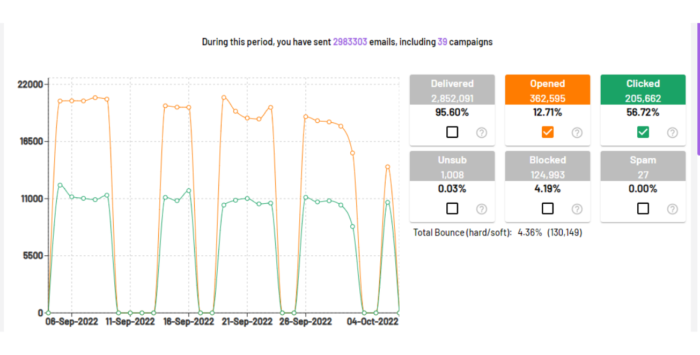
4 – Chart Metric Display: This display shows the number of views by the date period. The chart generates a line view for the Opened and Clicked metrics, where you can hover across each point to view the stats for that specific date. It would usually look like this along with the block display:
5 – Send details: Over here is a listed breakdown of the newsletter sends that fall into the date periods you’ve chosen. You would see the same fields as you would in the original newsletter list from the tab. These include the Newsletter name, Subject, Status, Last Edited, Recipients, Delivered, Unique Opens, and Unique Clicks.
And that’s all there is to it with Global Statistics, but what if you want to view the performance based on each newsletter and not by a date range?
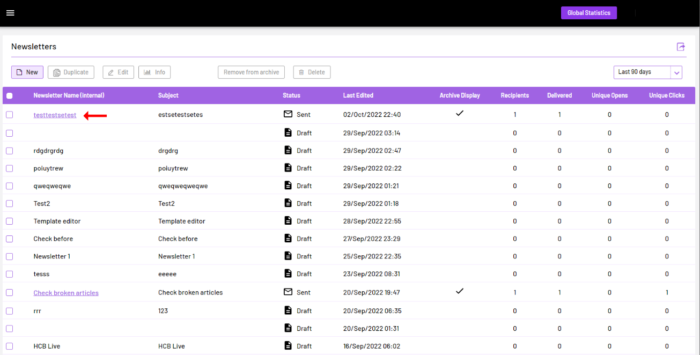
No worries, you can definitely work around that too! So now head back to the Newsletter tab, but instead of clicking on the Global stats, select a sample newsletter that you’ve already sent out and double-click on the name field as shown below:
Once you click on it, you should see this:
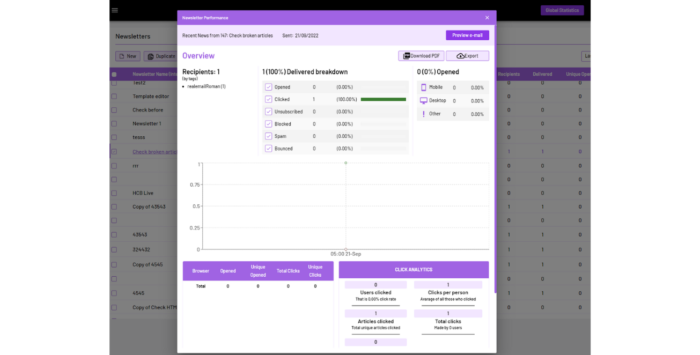
As you can see from above, this is the breakdown of the performance metrics of the newsletter. It displays the same information as for the Global stats, but these show the stats for the specific newsletter that you’re checking and will have different values and data for every other newsletter sent out.
For this view, you get to see the number of different subscribers and trackers, the browsers being used to access the newsletter, and click analytics. The Click analytics is a great Caboodle feature where you see the users that clicked, the ones that didn’t, total and unique clicks, and also the clicks per an article in the newsletter.
With all of these amazing tools for managing your newsletter statistics, we are certain that you’ll find all you need to track and optimise your content metrics to meet your requirements and goals as a whole.
Have any issues with your newsletter stats? Feel free to get in touch if anything looks out of the ordinary, and we’ll be right there to help.


